
AI Project Planning Framework for Business Value & Compliance

Why AI Projects Miss the Mark
Most AI projects stumble not on math but on miscommunication. Management speaks in outcomes, risk, and timelines; technical teams speak in datasets, metrics, and pipelines. Both are right—and both can be misaligned. This section offers a simple, shared lens for planning that keeps everyone talking about the same product.
Plan the system, not the model. An AI product is a socio-technical system spanning people, processes, data, models, and controls across distinct environments. When we fund “the model” in isolation, we underinvest in the parts that determine success in production: data quality, human oversight, monitoring, change management, and compliance.
A practical way to think about it: Decision to improve → People & oversight → Data → Model → Process/automation → Controls & evidence → Business value.
This keeps the business decision and its KPI at the center, clarifies who acts or intervenes, and treats controls (monitoring, rollback, documentation) as first-class features.
Equally important is respecting where work happens: a training environment to explore and learn, a testing environment to verify safety and usefulness under production-like conditions, and the production environment to deliver value reliably. Movement between these environments should be gated by clear evidence, not optimism.
This shared lens matters even more as regulation becomes real. Under the EU AI Act, leaders must demonstrate sound data governance (Art. 10) and meaningful human oversight (Art. 14) throughout the lifecycle—not as last-minute paperwork, but as integral design choices. Adopting a common planning language reduces friction, shortens review cycles, and makes “audit-ready” the natural by-product of good engineering.
Decisions Before Data
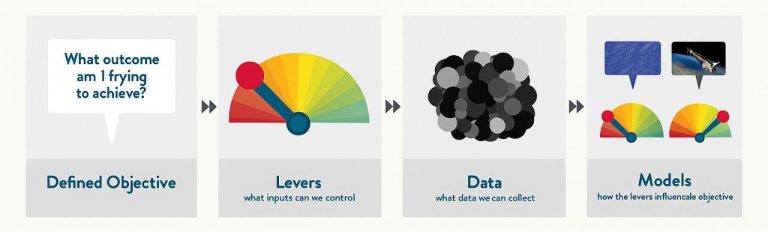
Figure 1 — The Drivetrain Approach: Outcomes-First Planning
The fastest way to add business value is to plan your AI product around decisions, not algorithms. The Drivetrain Approach (O’Reilly) is a simple sequence: Objective → Levers → Data → Models.
- Objective: What outcome are we trying to improve (e.g., cost per acquisition, yield per hectare, fraud loss avoided)?
- Levers: What can we actually control at decision time (offer, price, route, budget split, inspection priority)?
- Data (at decision time): What information will be available before the decision is made? Historical data is plentiful, but if it won’t be present at the moment of action, it can’t drive the decision. This forces a clear inventory of now-data historical-only vs. needs instrumentation.
- Models: Only after the above is clear do we choose prediction/optimization methods.
Two practical benefits follow:
- Avoiding the “historical mirage.” Teams often train on rich historical datasets only to discover that production decisions must be made with far less context and tighter latency. Planning from the decision backward highlights this gap early and prompts instrumentation (e.g., a sensor, a form field, a tracking pixel) to capture missing, decision-time signals.
- What-if analysis on levers. Because levers are controllable, your product should support scenario exploration before money or operations move.
Example — marketing budget: If the objective is lower Cost per Acquisition, the levers include platform allocation, bid strategy, and creative rotation. Decision-time data might include current campaign stats, audience size, and seasonality. The model estimates response; the product lets a marketer run what-ifs (“What if we shift 15% from Platform A to B?”) and compares projected outcomes under constraints (total budget, minimum spend per channel). This makes the model actionable and audit-friendly.
A helpful companion to this mindset is O’Reilly’s work on designing data-driven products: treat data collection, decision-time availability, and experimentation as product features, not technical afterthoughts. In regulated contexts (e.g., EU AI Act), this framing also makes compliance easier: you can show why specific data is collected (link to the decision), how oversight fits into the decision flow, and what evidence you generate at each stage.
Data-Centric vs. Model-Centric — Plan for Better Data First
Andrew Ng popularized a simple but powerful shift: treat data as the primary object of engineering. Instead of endlessly tuning architectures, make systematic improvements to the quality, coverage, and consistency of the dataset that teaches the model what “good” looks like. In his framing, data-centric AI means engineering the dataset with the same rigor we apply to code—so performance gains come from cleaner, better-labeled, and more representative data, not just from a new model trick.
Why this matters in planning: many teams (especially coming from academia) jump straight to model choice, then discover late that their labels are inconsistent, the data distribution shifts in production, or crucial signals are missing at decision time. Flipping the order de-risks delivery: plan the data work first, then layer models on top.
What to do in practice
- Lock the label schema early. Define classes, edge cases, and decision rules; write a concise labeling Standard Operating Procedure. Measure inter-annotator agreement and fix ambiguity before scaling. (This is core to the data-centric playbook.)
- Engineer for decision-time data. Distinguish signals you will have before the decision from those that exist only historically; instrument what’s missing. (Connects to the Drivetrain focus on decisions and levers.)
- Sample to represent reality. Ensure coverage across geographies, seasons, devices, customer segments, and rare-but-important cases; version the dataset as it evolves.
- Start with a strong baseline, then iterate the data. Train a simple, reliable model; run error analysis to discover labeling gaps, missing features, or skew; fix the data first, then consider model complexity. This is the cadence behind Ng’s data-centric push (and even a global competition demonstrated its effectiveness).
- Build feedback loops. In testing and production, capture corrections from users/experts and route them into continuous labeling and dataset updates. This shortens the path from error → improved data → better model.
Bottom line: If you budget and schedule for data quality, consistent labeling, and representative sampling up front, you can ship a useful baseline faster and then compound gains through targeted data fixes. Chasing ever-fancier models without this foundation is how projects burn time and miss their business outcomes.
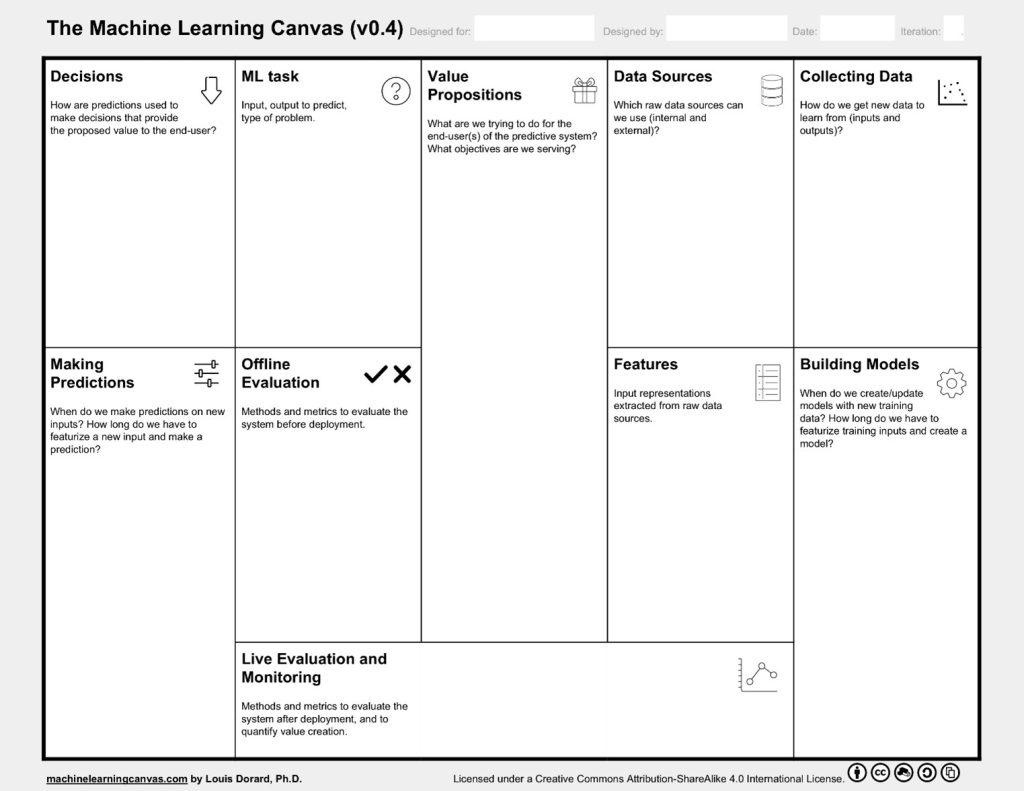
Figure 2 — Machine Learning Canvas template. Source: machinelearningcanvas.com (Louis Dorard), CC BY-SA 4.0.
The canvas is a one-page planning surface that keeps mixed teams aligned on value creation. Start with Decisions and Value Proposition: what decision are we improving, for whom, and which key performance indicators (KPI) will prove it. State the ML Task in plain terms (input → output). Then map Data Sources you’ll rely on and be explicit about Collecting Data—what will exist at decision time, who owns it, and what instrumentation you must add.
With the data reality clear, sketch the essential Features and their refresh cadence. Only then discuss Building Models: establish a simple, reproducible baseline and when you’ll update it. Describe Making Predictions operationally—where predictions surface, latency/throughput expectations, who acts on them, and how human oversight works in practice. Close by defining Offline Evaluation tied to business impact before go-live, and Live Evaluation & Monitoring after deployment (drift, alerts, retraining triggers).
Used this way, the canvas becomes your cross-functional contract: it anchors the Drivetrain sequence (objective → levers → data → models), maps neatly to training/testing/production, and shortens reviews because rationale, oversight, and data governance are explicit from day one.
The AI Lifecycle
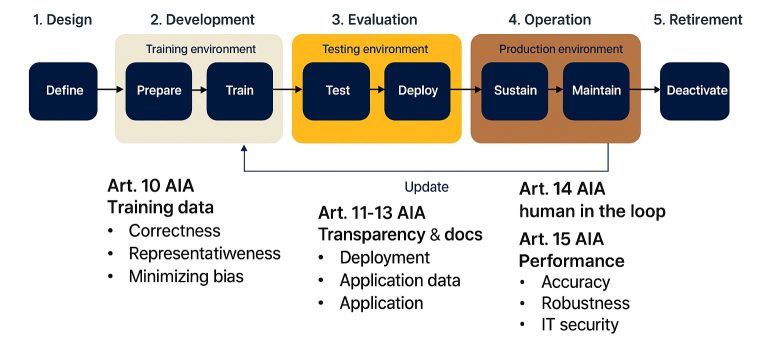
Figure 3 — AI Lifecycle aligned with EU AI Act overlays
AI delivery is no longer just a technical pipeline; it is a technical + regulatory lifecycle. For planning purposes, think in five plain stages that move across three environments—training, testing, and production—with two constant overlays: Article 10 (data governance) and Article 14 (human oversight). The value of this view is practical: it tells you what decision to make at each stage, which evidence to produce, and who must sign off.
Design
Frame the decision and the KPI, outline who uses the system and who can intervene, map data sources and legal grounds for using them, and set initial risk assumptions. The planning question here is: Do we have a problem worth solving, permission to use the data, and a credible path to obtain decision-time signals? Output: a filled ML Canvas, a short data inventory with ownership and access rights, and a first sketch of the oversight concept.
Development (training environment)
Engineer the dataset and the labeling protocol, document representativeness and known limitations, and implement a reproducible baseline. This is where Article 10 becomes concrete: lineage, versioning, and quality checks are built into the work, not appended later. The gate is not “the model looks good,” but the dataset is fit for purpose and a baseline meets agreed offline thresholds. Output: dataset card, labeling SOP, experiment report, reproducible pipeline.
Evaluation (testing environment)
Prove safety and utility under production-like conditions. Run shadow tests or a limited pilot, finalize the human-in-the-loop design, and define rollback/kill-switch criteria. Here Article 14 becomes operational: who can override, when, and what evidence the interface captures. The decision is: Are we authorized to deploy or expand the pilot, with clear incident management and accountability? Output: test plan and results, oversight playbook, deployment checklist, go/no-go record.
Operation (production environment)
Deliver value reliably and keep the system within approved bounds. Monitor business KPIs, input and prediction drift, and fairness/quality constraints; run controlled updates; document changes. Post-market monitoring is part of the product. The recurring decision is: Are we still safe and effective; do we retrain, roll back, or escalate? Output: live dashboards, alert thresholds, retraining logs, change records, incident post-mortems.
Retirement
Plan sunsetting criteria early. When decommissioning, meet data retention/disposal obligations and archive artifacts for auditability. The decision is: Is the system still the best way to achieve the objective—or should we turn it off cleanly? Output: retirement checklist, comms note, archive index.
Across Development → Evaluation → Operation, updates feed back through the loop with proportional rigor: small parameter changes may follow a light path; material changes to data, model behavior, or risk profile return to testing before production. This lifecycle gives sponsors and teams the same rhythm: experiment fast inside stages; cross stages only with evidence. It reduces rework, shortens regulatory reviews, and—most importantly—keeps the focus on delivering measurable, compliant business value.
Technology Preparedness Levels (TPL)
| TRL | Description |
| TRL 9 | Actual AI system deployed and proven in real-world operations (e.g., fully operational AI in production). |
| TRL 8 | AI system completed and tested in an operational environment (e.g., final validation and qualification in real use cases). |
| TRL 7 | Prototype AI system demonstrated in an operational environment (e.g., tested with real-world data in the target environment). |
| TRL 6 | AI system or subsystem prototype demonstrated in a relevant environment (e.g., system is tested with representative data). |
| TRL 5 | AI component or algorithm validation in a relevant environment (e.g., tested with real or near-real data). |
| TRL 4 | AI component or algorithm validation in a laboratory environment (e.g., validated in a controlled setting with simulated data). |
| TRL 3 | Experimental proof-of-concept for AI system (e.g., algorithms validated through initial testing or simulations). |
| TRL 2 | AI concept and initial methodology formulated (e.g., theoretical models for the AI approach are developed). |
| TRL 1 | Basic principles and underlying AI technologies observed and reported (e.g., initial research and AI model exploration). |
Table 1 — TRL/TPL levels
TPL gives EU projects a shared, evidence-based rhythm: iterate quickly inside a level, then pause at the gate to show what you’ve learned and decide whether to advance. It’s not waterfall; it’s lean discovery with formal checkpoints sponsors and auditors recognize. Early on you’re proving feasibility—separate files, lightweight scripts, and small curated datasets are fine as long as results are reproducible and tied to a real decision. In the middle you integrate a minimal user interface (UI) or application programming interface (API), run in a testing environment that resembles production, and validate usefulness with real users (including clear human-in-the-loop and rollback plans). At the top you operate like a product: Machine learning operations (MLOps) automates validation, deployment, monitoring, and change control; post-market responsibilities are routine, not ad hoc. Throughout, end users stay in the loop so you optimize for actual decisions—not just offline metrics.
Stages to plan around:
- TPL 1–3 (Proof of Concept): learn fast; confirm access to decision-time signals; produce a reproducible baseline and a credible path to production-grade data.
- TPL 4–6 (Prototype in a relevant environment): integrate UI/API; run pre-prod tests; demonstrate performance holds outside the lab; finalize oversight and rollback.
- TPL 7–9 (Product in operation): harden with MLOps; control updates and retraining; keep an audit-ready trail for conformity needs.
Terminology note: Many EU/R&D contexts publish this ladder as TRL (Technology Readiness Levels). We use TPL/TRL interchangeably below.
Case Example — Remote Sensing for Crop-Disease Hotspots
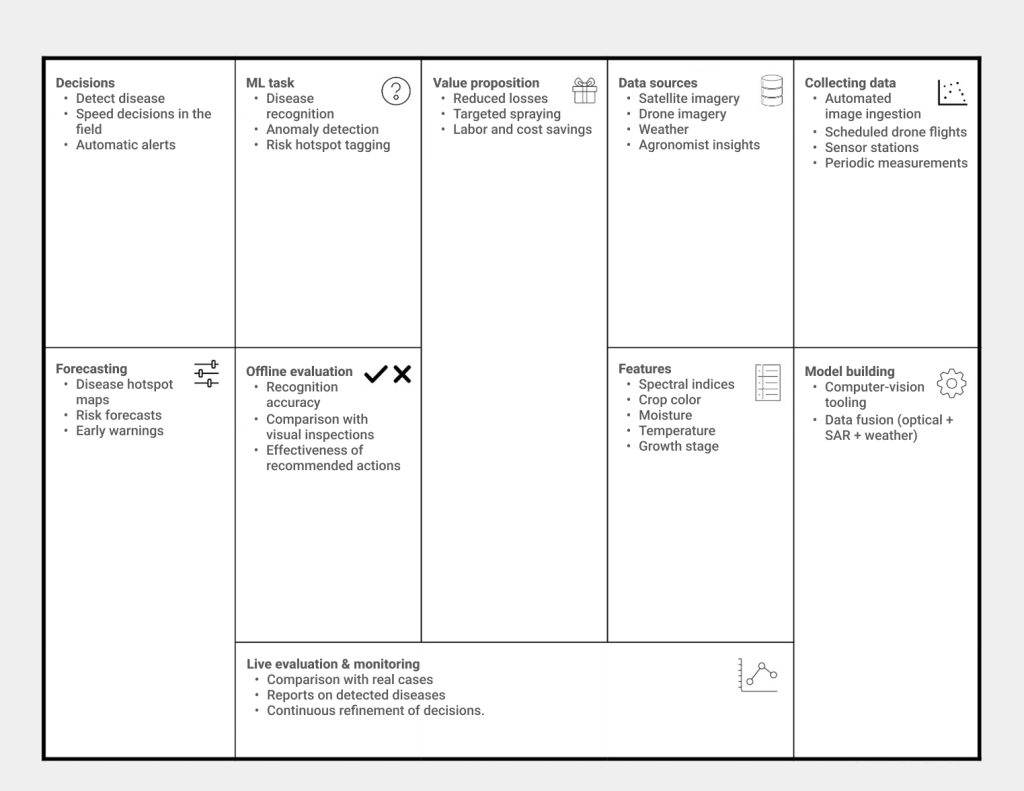
Table 2 — ML canvas example, Agriculture disease detection & crop health
We start by aligning everyone on the ML Canvas. The decision at the center is where and when agronomists should act (inspect, spray, or wait) to minimize loss. The value proposition is fewer losses and more targeted spraying. On the right, we commit to decision-time data—recent cloud-free satellite tiles (e.g., Sentinel-2), short-term weather, parcel boundaries and crop types, last field notes—with drones as on-demand high-resolution checks. This prevents the “historical mirage,” where rich training data isn’t available when a real decision must be made. The canvas also captures early Article 10 and Article 14 choices: who owns the data, who may intervene, and how that intervention is logged.
With the canvas agreed, we follow a data-centric path. First we define the disease list and a simple severity scale (none/low/medium/high) at the parcel level, tied to the crop’s growth stage. We also decide how images will be cleaned, how clouds and shadows are handled, and how we’ll split data by region and season so tests reflect real operating conditions. Labeling rules are written down, checked for consistency, and improved with agronomist feedback. Only after this foundation is in place do we talk models. We start with a straightforward, dependable baseline to produce the first hotspot maps and use its mistakes to improve the data (labels, coverage, edge cases). If real gaps remain, we then step up—adding models that look across time or combine satellite with weather—but only when they solve a clear problem and still meet our speed and cost constraints.
The lifecycle drives cadence and evidence, and TPL provides the stage-gates. Inside each stage we iterate lean; at the gate we show small, consistent artifacts and decide whether to proceed.
| Lifecycle stage | Target TPL band | What we do | Gate evidence & go/no-go question |
| Design | TPL 1–2 | Clarify decision/KPI, users and overseers; map data rights/access; draft label schema and phenology tags; select pilot regions. | ML Canvas; data inventory & legal basis; sampling plan; label SOP draft. Go? Problem worth solving, permitted data, credible decision-time signals. |
| Development (training env.) | TPL 3–4 | Curate representative samples; calibrate labeling; build reproducible pipelines; train baseline models; quantify errors by crop/region/season; instrument gaps (parcel registry, ground-truth app). | Dataset/feature cards; baseline report tied to KPI; reproducibility proof. Go? Dataset fit for purpose; baseline clears offline thresholds. |
| Evaluation (testing env.) | TPL 5–6 | Stand up pre-prod pipeline; lightweight web UI; shadow runs and limited pilots; finalize human-in-the-loop and rollback/kill-switch; only add advanced models where it removes real errors. | Pilot results; oversight playbook; deployment checklist. Go? Authorized to deploy/expand pilot with incident plan. |
| Operation (production env.) | TPL 7–9 | Build MLOps spine: scheduled ingestion & preprocessing, versioned data/models, monitoring & alerts, retraining governance; post-market monitoring and economic impact reporting. | Live dashboards; drift & quality thresholds; change records; retraining logs; audit bundle. Stay? Safe, effective, value-creating within approved bounds. |
| Retirement | — | Define sunsetting criteria; archive artifacts; meet retention/disposal duties; stakeholder comms. | Retirement checklist; archive index. Close? Obligations met; decommission complete. |
Table 3 — Integrating the AI Lifecycle and Technology Preparedness Levels (TPL).
Turning this into a data product means improving decisions, not just pixels. The UI overlays agronomic and economic layers—fertilizer and spray histories, soil chemistry (pH, OM, NPK), SAR-derived soil moisture, topography, machinery/labor windows, buffer zones, and chemical prices—so users can run what-if scenarios (e.g., “shift 20% of spray budget to high-risk/high-ROI parcels”) and see projected hectares protected, cost, and lead time. Each action writes back structured feedback (confirmed/false hotspot, treatment applied, outcome), closing the loop for continuous labeling and model improvement.
Planned this way—canvas first, data-centric build, lifecycle cadence with TPL gates, and a product surface for what-if decision-making—the project moves from curated samples to credible pilots and then to dependable operations, with compliance and evidence generated as a natural by-product of delivery.
Reference
- AICR Consulting. (2024, September 23). AI R&D for European Commission funding: AI Act challenges. https://aicrconsulting.com/news/ai-rd-for-european-commission-funding-ai-act-challenges/
- AICR Consulting. (2024, October 29). Comprehensive national framework for AI governance: Ensuring compliance and innovation under the AI Act in Lithuania. https://aicrconsulting.com/news/comprehensive-national-framework-for-ai-governance-ensuring-compliance-and-innovation-under-the-ai-act-in-lithuania/
- AICR Consulting. (2024, September 23). The role of AI and remote sensing in transforming agriculture. https://aicrconsulting.com/news/the-role-of-ai-and-remote-sensing-in-transforming-agriculture/
- Dorard, L. (2015). Machine learning canvas. OWNML. https://www.ownml.co/machine-learning-canvas
- Howard, J., Loukides, M., & Zwemer, M. (2012). Designing great data products. O’Reilly Media. https://www.oreilly.com/radar/drivetrain-approach-data-products/
- Landing AI. Data-centric AI: A data-driven machine learning approach. Retrieved August 16, 2025, from https://landing.ai/data-centric-ai

About author
Dr. Valentas Gružauskas is an expert in AI governance, conformity assessment, and ethical AI applications. As an Associate Professor at Vilnius University and CEO of AI Conformity & Research Consulting, he leads initiatives in AI regulation and ISO standards. He actively participates in AI governance through the Horizon Europe Programme and various standardization committees. Dr. Gružauskas has made significant contributions to fields like machine learning, deep learning, and agent-based modeling, with a focus on AI ethics and data depersonalization. His work is widely published in esteemed journals, reflecting his impact and recognition in the AI community.